Data Visualisation Concept
Overview
Designed an interactive interface to articulate and interogate large quantities of qualitative data as part of a collaborative SMART grant project.
Skills
Project Management | Wireframing | UX/UI Design & Prototyping | Logistics and Problem Solving | Cross-functional collaboration
Background
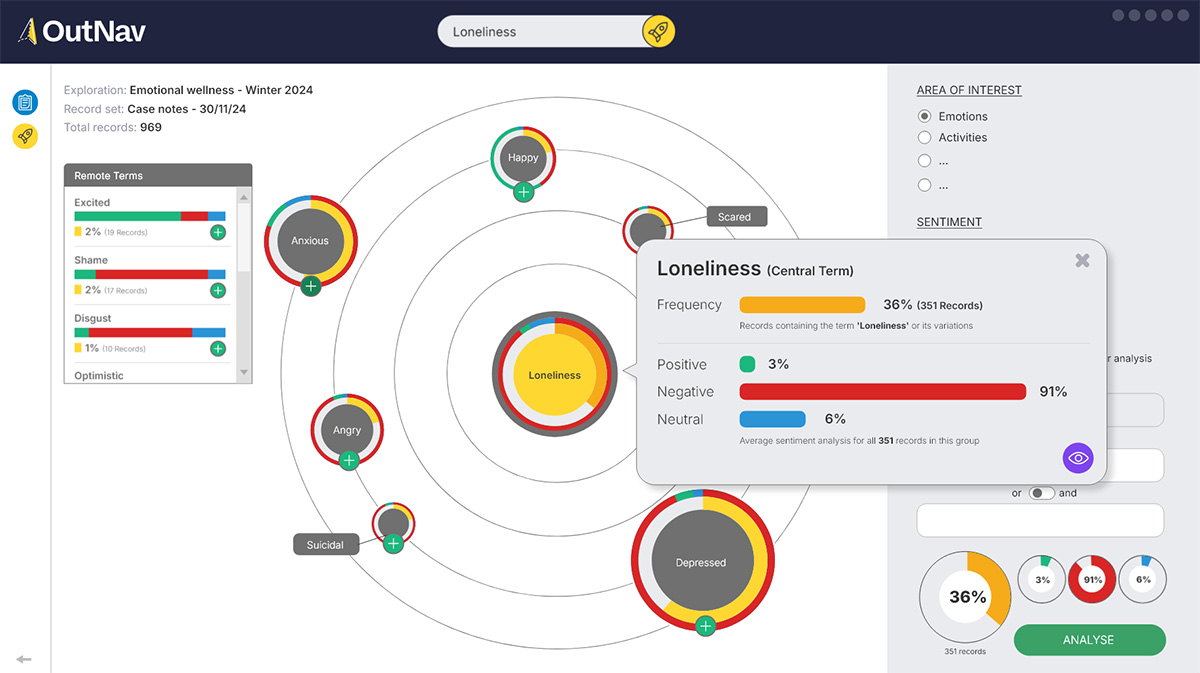
- Project sought to validate the potential for AI to analyse substantial qualitative datasets and present the findings back in an intuitive, innovative, and exploration-friendly format.
- Asked to design an interface where researchers can identify and explore patterns and themes in large data-sets that were previously unobtainable through manual analysis.
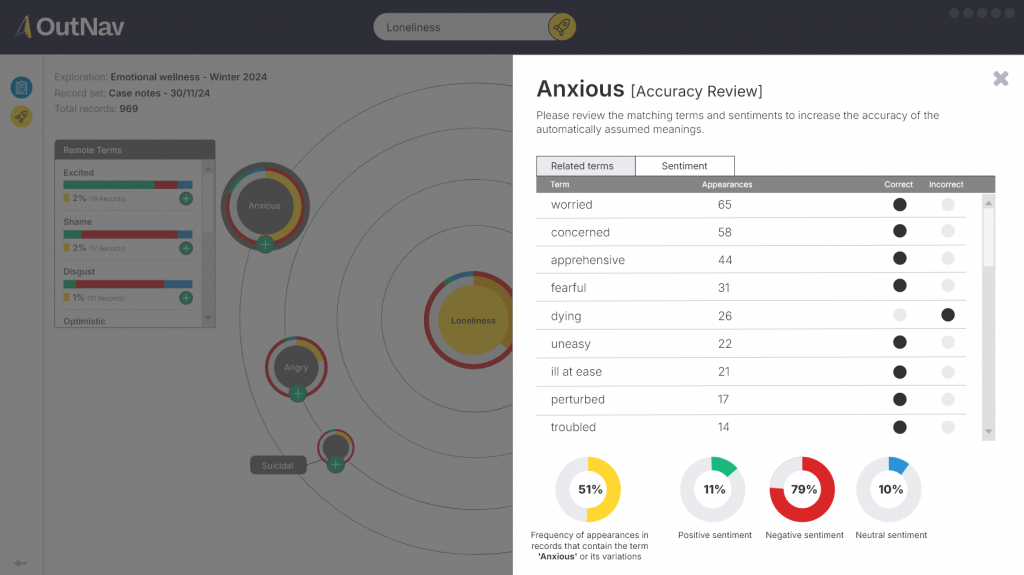
Design Challenge
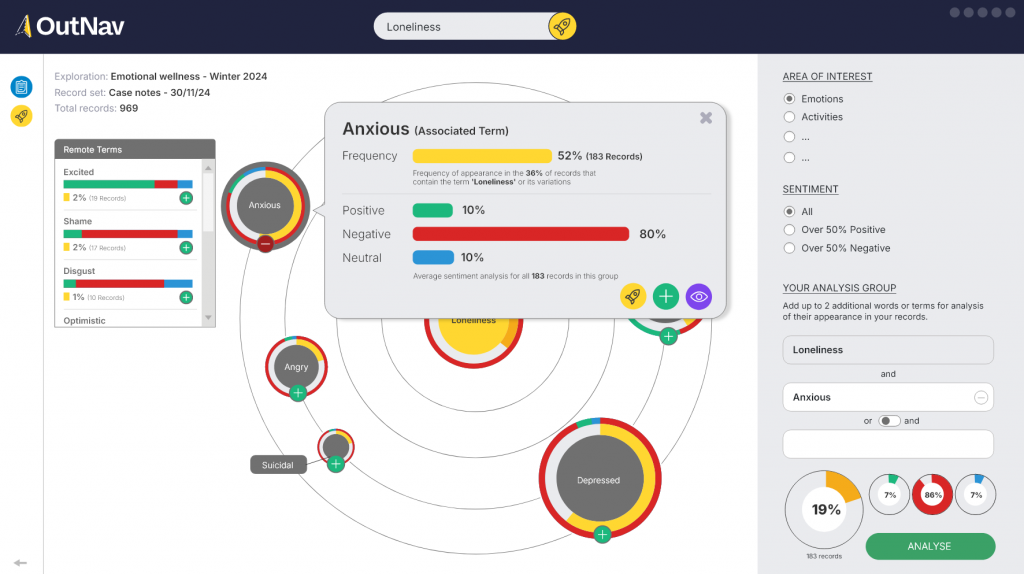
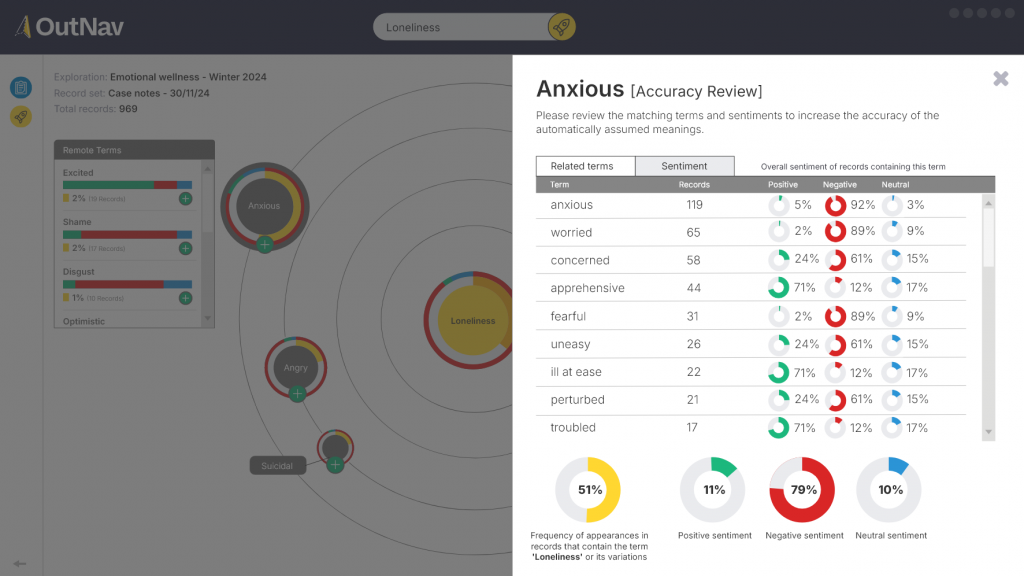
- Visually represent large qualitative analysis output in a compelling way.
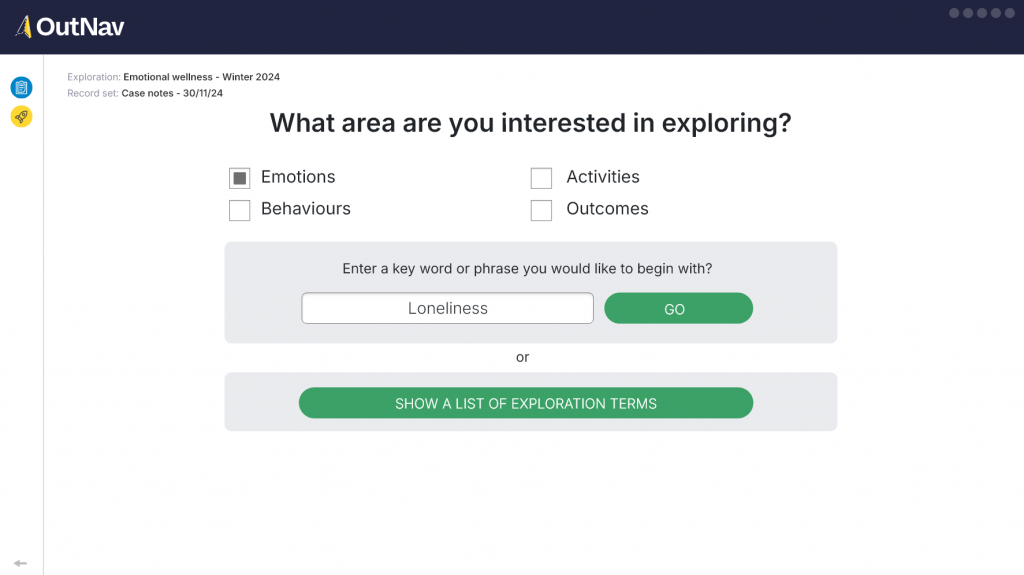
- Create an intuitive, engaging way to discover hidden meaning and patterns from large data sets.
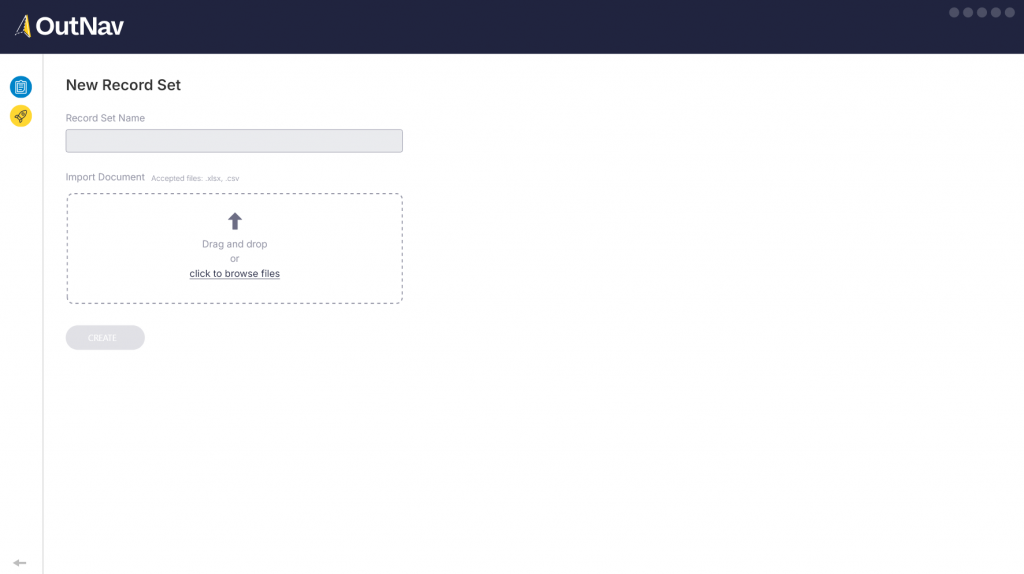
- Allow users to filter, iterate, and visualise real-time results without technical expertise.
- Design an intuitive interface that empowers users to train AI models directly inside a project.